 Almetra AIformerly Deltia
Designing an enterprise product from 0 to 1 to help line leaders take action.
01 — The problem
Lots of data. Now what?
For the first time, manufacturing companies could see what was happening on their lines, and we turned it into data. The only problem: how do you make that data actionable?
02 — Version one
The dashboard
The dashboard gave line leaders the main KPIs and helped them find bottlenecks by product, day or station. It looked cool, but it was hard to know what to do with it.
What worked
- Main KPIs at a glance
- Powerful filters to find bottlenecks
What didn’t
- Took time to analyze
- No clear next step
03 — Research
What we learned
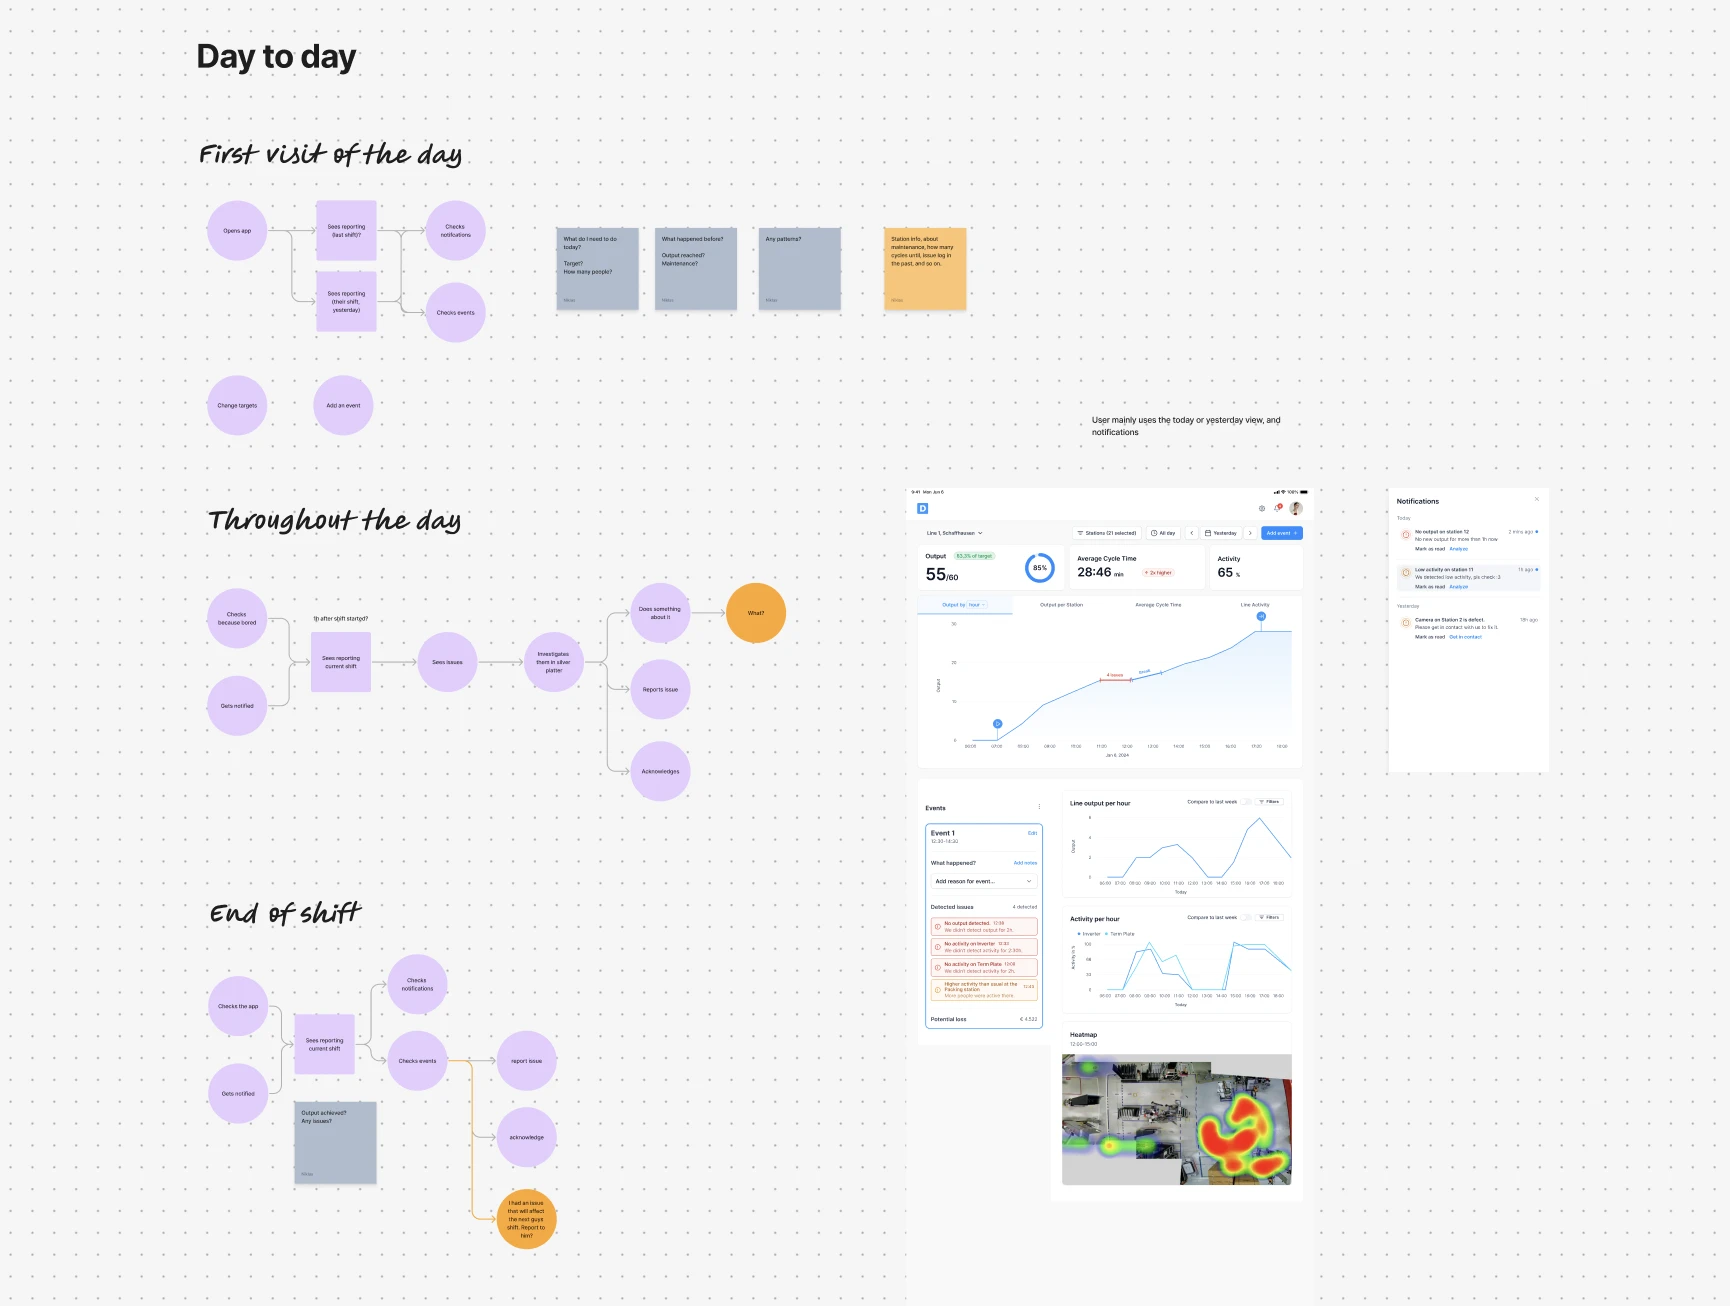
Shop-floor managers are busy. They don’t have time to analyze dashboards, and when they do, they only look at today and yesterday. The only station that really matters is the bottleneck of the line.
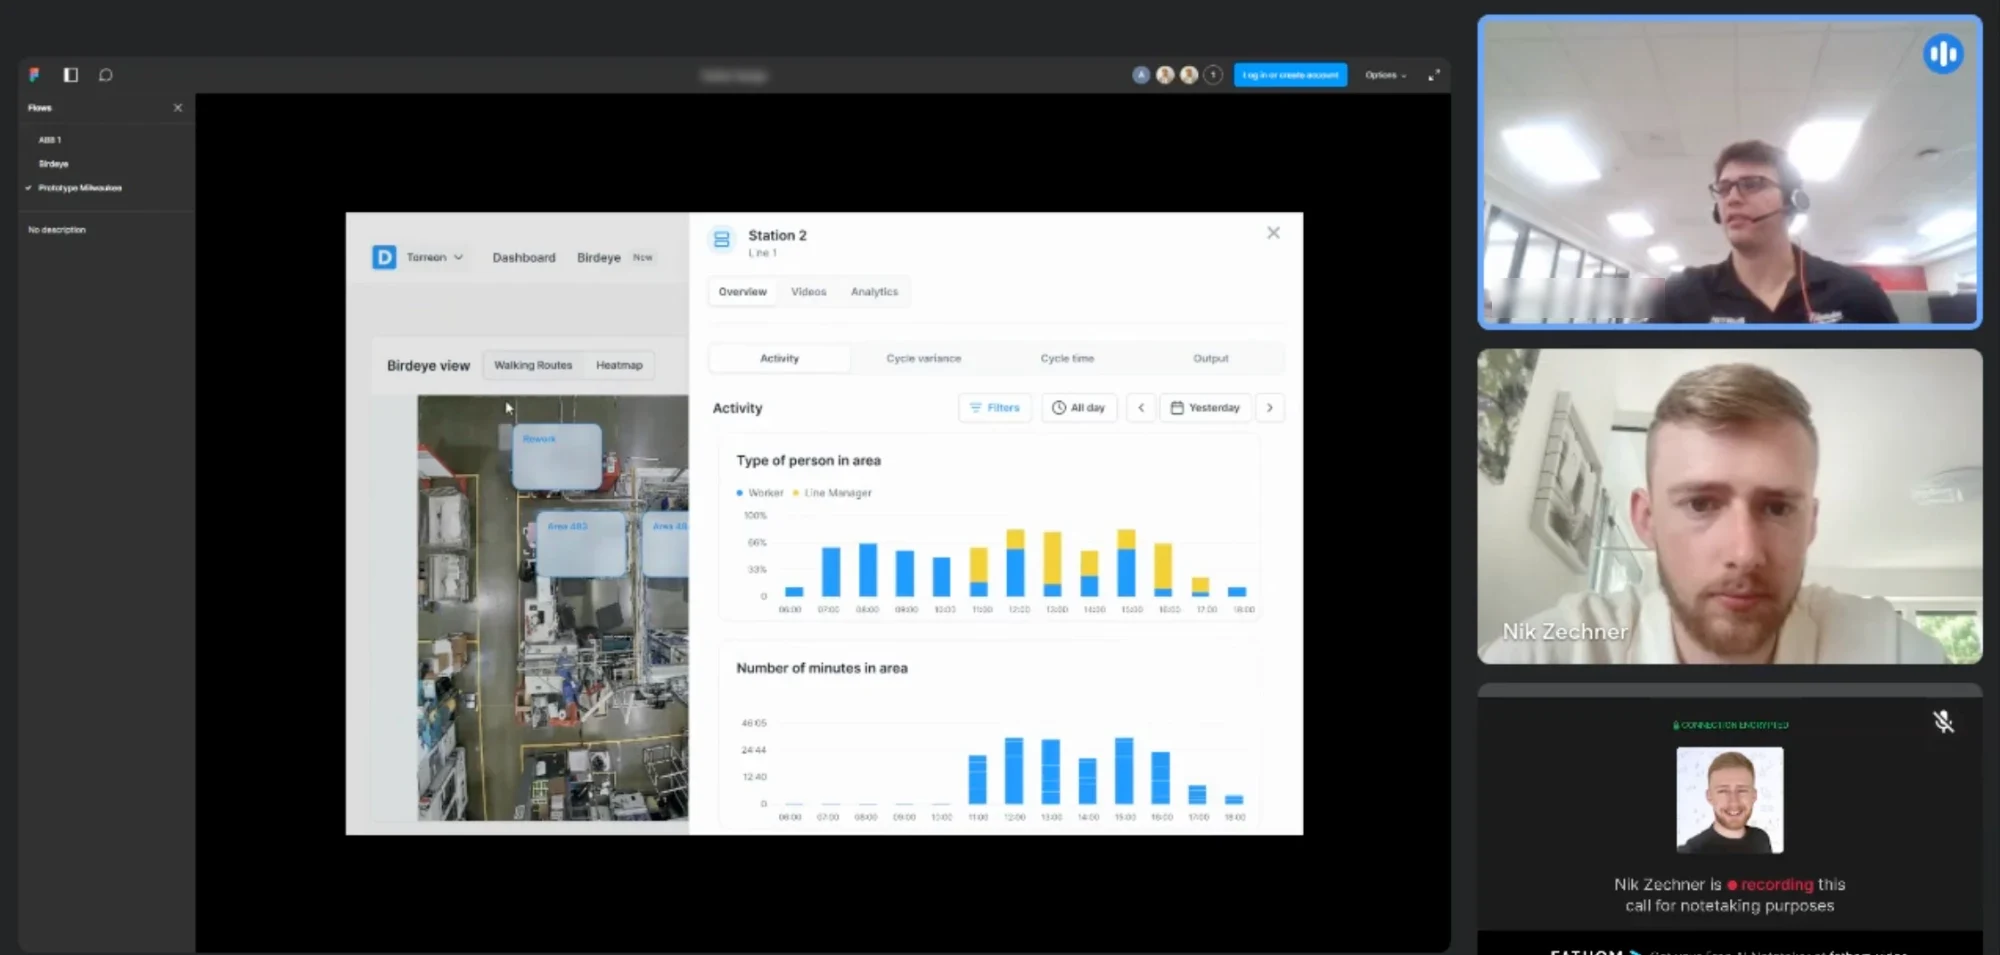

Design sync
Mar 4, 2024
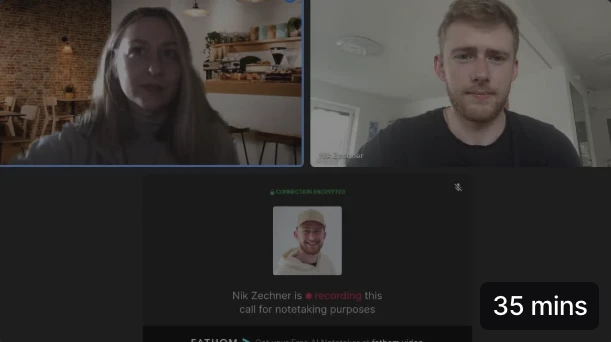
UX interview
Apr 12, 2024
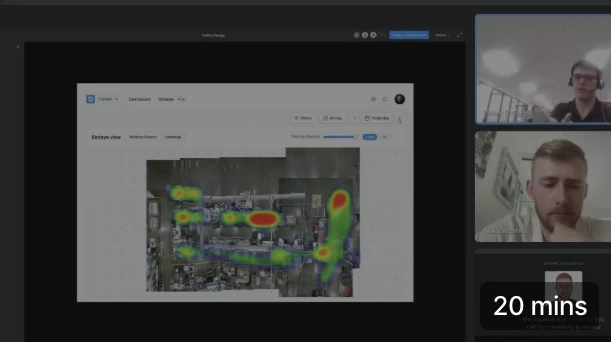
Thinking-aloud test
May 29, 2024
04 — Insights
From charts to answers
Each station gets one column with its key KPI and at most two insights in plain language: what’s wrong, where, and what to do. Resolving one takes a tap, and the feedback trains the model.
- One column per stationIts key KPI, plus one pill per hour to show when things went wrong.
- Ranked insightsFour types, so the icon alone tells you how urgent it is.
- Resolving is feedbackEvery answer teaches the model what’s worth flagging.
05 — The design system
The design system
Built on shadcn/ui, so engineers could ship the designs as they are. Every component covers every state: empty, loading, error, shift change, light and dark.
06 — The handover
One report for the next shift
At shift change, everything rolls into one report: a short summary, the main KPIs and the insights worth keeping. Numbers that aren’t final yet show a question mark instead of a value that changes later.
07 — What’s next
Ask Almetra
The next step: anyone on the line can just ask, and get an answer with the chart that proves it and the next action.
This is a concept, not part of the live app.
08 — Outcome
What changed
Almetra raised a €16M Series A and now serves $1B+ companies with its insights. I helped the team figure out what really matters, and designed it so engineers could ship it easily.